
Dark Matter in Drug Development: The Invisible Dependencies Driving Your Portfolio
The pharmaceutical industry just spent $370 billion because it recognized one coupling channel. There are at least four others, and none appear in any project plan.

In December 2024, Novo Holdings completed its $16.5 billion acquisition of Catalent, securing three fill-finish manufacturing sites and an estimated $11 billion in production capacity for GLP-1 therapies. For Novo, it was a strategic masterstroke. For dozens of biotech companies that had spent years negotiating manufacturing slots at those same facilities, it was a Monday morning phone call that rewrote their development timelines overnight.
Their science hadn't changed. Their clinical data was intact. Their regulatory strategies were sound. But a capacity decision made in someone else's portfolio cascaded into theirs through a channel that appeared nowhere in their project plans.
What followed was the largest capital mobilization in pharmaceutical history. By late 2025, the industry had committed over $370 billion in US manufacturing investment. Lilly pledged $50 billion across four new sites, having broken ground in Lebanon, Indiana as early as 2023. Pfizer committed $70 billion. J&J, AstraZeneca, and Roche each committed $50 billion or more. Novartis announced $23 billion across ten facilities. A construction industry veteran with 35 years of experience told DPR's quarterly survey he had never seen the sector this hot.
Whether driven by tariff compliance, strategic capacity control, or both, the scale of the response tells us something important. The pharmaceutical industry recognized, for the first time at this magnitude, that manufacturing capacity is not a procurement detail. It is a portfolio-level strategic variable, one that cascades across programs when it shifts, and one that no individual project plan had ever modeled as a shared dependency.
That recognition is real. It is also incomplete.
In physics, dark matter cannot be directly observed. Scientists detect it by its gravitational effects on visible objects, the way galaxies rotate faster than their visible mass explains, the way light bends around masses that shouldn't be there. You know it exists because visible matter behaves in ways that only make sense if something invisible is exerting force.
Portfolio dependencies work the same way. You cannot see them in any individual project plan. But they account for most of the unexplained variance in your portfolio's trajectory. A program that was green last quarter turns red this quarter, and nobody can explain why because the cause originated in a different program, through a shared resource that both plans treated as exclusively their own.
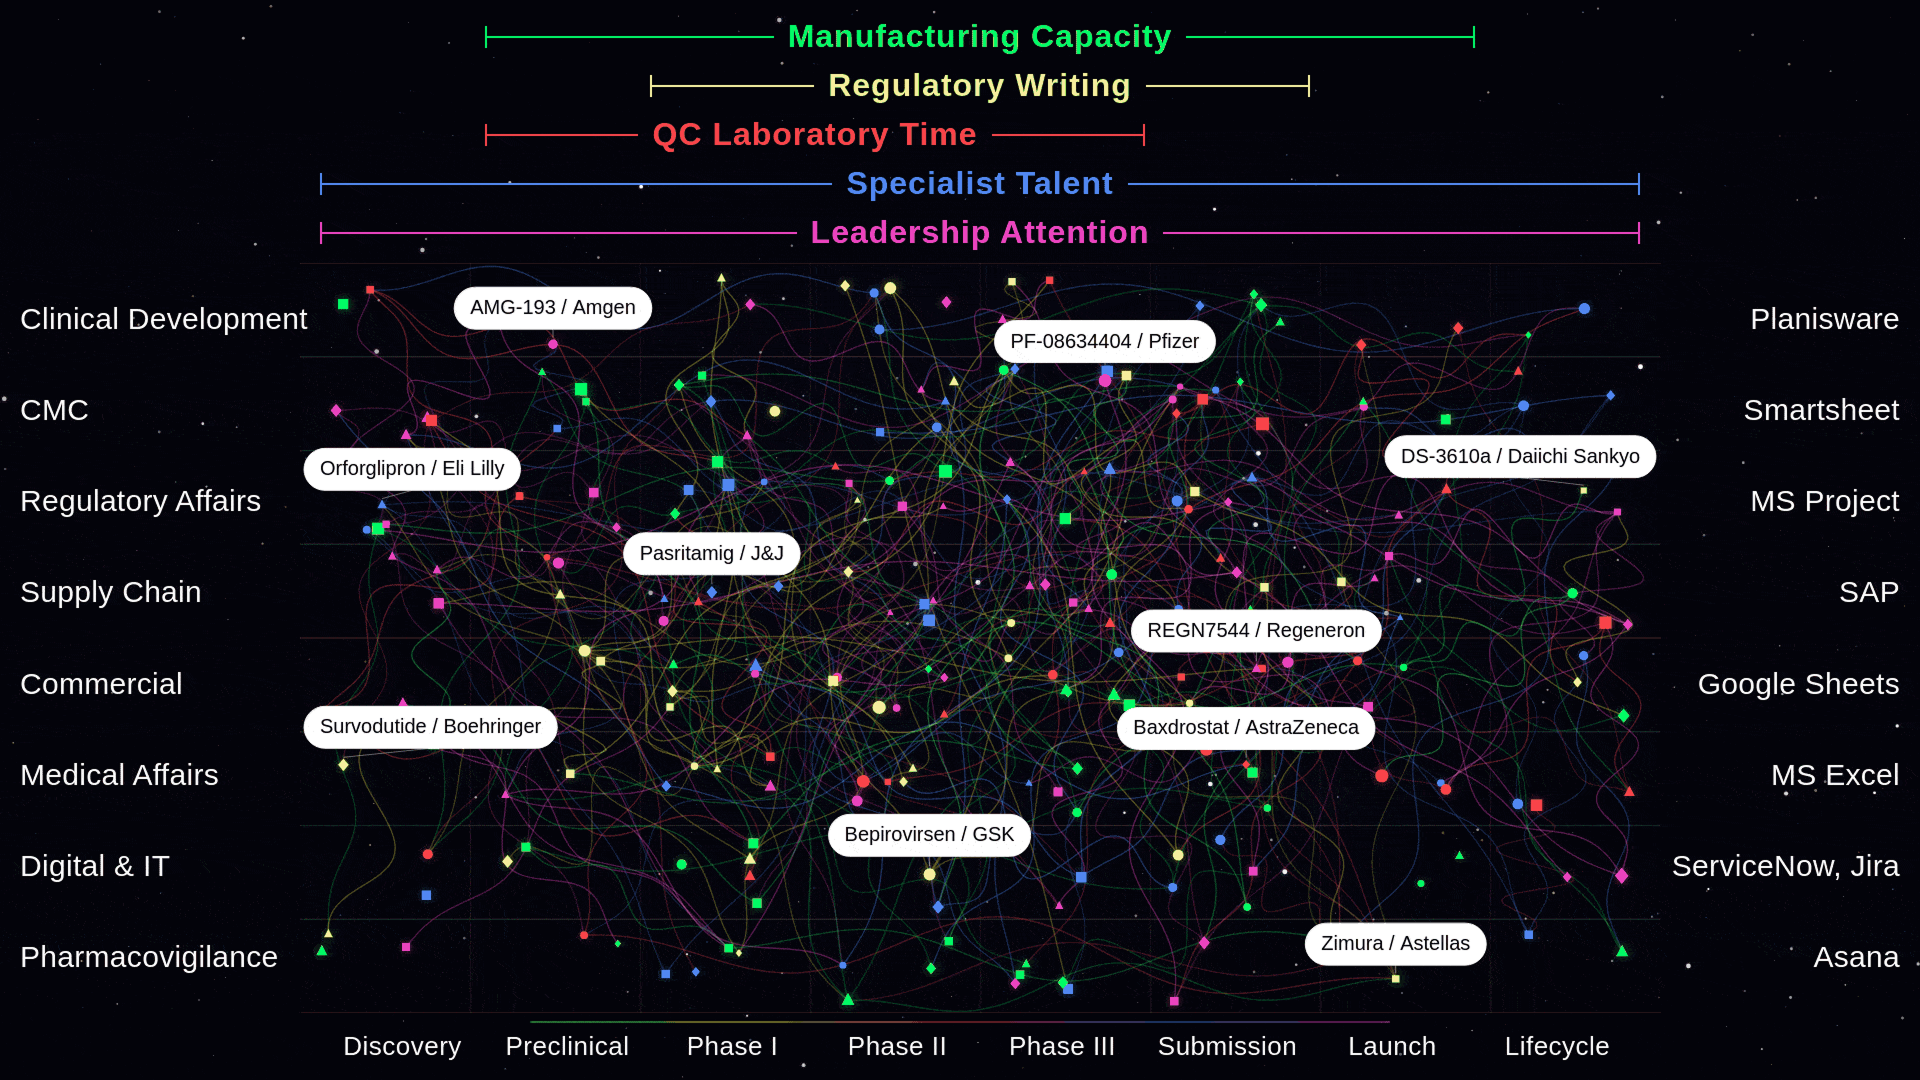
Manufacturing is one coupling channel. The $370 billion addresses it. But in twenty-five years of working across pharmaceutical operations and thirteen years building coordination systems for this industry, I have watched four other coupling channels generate the same cascade dynamics, the same schedule variance, and the same organizational surprise. The difference is that nobody has spent $370 billion to make those visible. Not yet.
The Five Channels Nobody Maps
The Catalent acquisition made one coupling channel impossible to ignore. But manufacturing capacity is not the only shared resource through which programs propagate delays across a portfolio. It is simply the one where the cascade finally became dramatic enough to trigger a response.
Consider how pharmaceutical portfolios actually operate. A mid-to-large pharma company manages 300 to 500 active programs simultaneously. Each program has its own project plan, its own milestones, its own risk register. Portfolio governance evaluates them one at a time: Is Program A on track? Is Program B on track? The implicit assumption is that if each program is individually healthy, the portfolio is healthy.
This assumption is wrong. Programs that appear independent share resources through at least five coupling channels. When one program consumes, delays, or monopolizes a shared resource, every program sharing that resource absorbs the impact. Nobody planned for the contention because each program planned in isolation.
The first channel, CDMO and manufacturing capacity, is now visible. The Novo-Catalent acquisition demonstrated that a single capacity decision can cascade across an entire outsourcing ecosystem. CDMOs, by industry accounts, "abandoned some customers and ghosted potential newcomers" as capacity consolidated. The global CDMO market reached $238.9 billion in 2024, projected to grow to $465 billion by 2032, and still cannot meet demand. Securing manufacturing slots now directly impacts fundraising success and company valuation for emerging biotech. The industry's $370 billion response validates this channel's strategic importance, even as specialized bottlenecks in fill-finish, high-potency API processing, and viral vector production continue to intensify.
The second channel is regulatory writing bandwidth. In a typical large pharma organization, the same fifteen regulatory writers serve thirty or more programs. When two submissions converge in the same quarter, one program yields, not because of a scientific issue, but because the shared writing resource cannot support both simultaneously. Each program planned its submission timeline independently. Neither modeled the contention. The delay appears in one program's status report as a "timeline adjustment." The cause, resource-mediated coupling with another program, appears nowhere.
The third channel is quality control laboratory time and tech transfer capacity. Tech transfer, the process of moving a manufacturing process from development to commercial scale, remains one of the most failure-prone handoffs in drug development. When one program's tech transfer fails, the manufacturing queue for the entire portfolio shifts. Downstream programs that were counting on production slots find those slots occupied by rework from the failed transfer. The Parenteral Drug Association has documented that product launches are routinely "delayed months or years" by tech transfer complications, and those delays rarely stay contained within a single program.
The fourth channel is specialist talent, and this is where the $370 billion investment creates a paradox. Every new manufacturing facility requires QA/QC specialists, validation engineers, regulatory writers, and maintenance experts from the same finite talent pool. The industry currently carries approximately 60,000 unfilled biopharma positions, representing an 8 percent workforce gap. PharmaSource identified talent scarcity in these specialized roles as a "structural bottleneck" heading into 2026. New buildings without the people to operate them are empty buildings. Capacity investment in one coupling channel intensifies coupling in another.
The fifth channel is leadership attention. CEOs, chief medical officers, and portfolio committee members have finite bandwidth. When a crisis erupts in Program A, leadership attention redirects. Programs B through F lose executive sponsorship, not because they became less important, but because the shared resource of leadership focus shifted. Nobody models "leadership attention" as a shared resource in any project plan. But it behaves exactly like one, and its sudden reallocation cascades across the portfolio as surely as a lost manufacturing slot.
These five channels operate simultaneously. And they operate against a backdrop that makes coupling more dangerous, not less. The pharmaceutical industry faces $200 to $300 billion in annual revenue at risk through patent expirations by 2030. Novartis alone is losing an estimated $4 billion in sales and nearly $4 billion in profits in the first half of 2026, what the company has called "the largest set of loss of exclusivities in Novartis' history." More programs are competing for the same finite resources. The coupling intensifies precisely when organizations can least afford cascades.
Manufacturing was the first coupling channel dramatic enough to trigger a $370 billion response. But it is only one of five channels through which programs cascade across the portfolio. The other four remain invisible in every project plan.
Why Nobody Sees the Cascades Before They Arrive
The invisibility is not accidental. It is structural. The way pharmaceutical organizations plan, resource, and govern their portfolios ensures that coupling remains undetectable until it has already propagated.
Start with how programs are planned. Every project plan lists within-program dependencies meticulously: Clinical provides data to Regulatory, Regulatory submission gates CMC readiness, CMC scale-up gates commercial supply. These within-program dependency chains are well mapped. What no project plan lists is the between-program dependency: "Our CDMO campaign depends on Sponsor X's campaign completing its run first," or "Our regulatory submission competes with three other internal programs for the same writing team in Q3." Each program plans as if the resources it needs will be available when it needs them. The contention that arises when five programs need the same resource in the same quarter appears in no individual plan, because no individual plan was designed to model it.
Operations research confirms this mechanism is not speculative. Browning and Yassine analyzed over 12,000 multi-project scheduling problems and found that resource contention between projects, not complexity within any individual project, is what determines whether delays cascade. In shared-resource environments, it is the coupling between projects that drives schedule variance. The findings are unambiguous, and they describe exactly the environment in which pharmaceutical portfolios operate: dozens of programs sharing CDMO partners, regulatory writers, QC laboratories, and specialist talent simultaneously.
Organizations compound the problem by staffing to current portfolio requirements with minimal slack. As World Pharma Today documented in December 2025, "any deviation from anticipated portfolio requirements rapidly produces resource constraints." Annual planning cycles allocate headcount and budget based on the portfolio as it exists when the plan is written. But portfolios are not static. A trial enrolls faster than expected. A regulatory authority issues an unexpected request. A competitor's approval reshapes the commercial landscape. Each deviation creates resource demand that the annual plan never anticipated, and that demand cascades across every program sharing the affected resource.
The result is a velocity mismatch that makes detection structurally impossible under current governance. Cascades propagate at the speed of operational reality: weeks, sometimes days. A CDMO partner delays one campaign by two weeks, and the downstream effects ripple across three other programs within the month. But portfolio governance convenes quarterly, sometimes monthly at best. By the time the portfolio committee sees three programs simultaneously turning from green to amber, the cascade originated two quarters earlier in a capacity decision that nobody flagged because it wasn't anyone's job to flag it.
Cascade propagation speed: weeks. Governance detection speed: quarters. That gap is where portfolio value quietly disappears.
The Root Cause, and Why the Problem Is Accelerating
The coupling itself is inherent. Any portfolio that shares resources across programs will experience resource-mediated cascades. Any program where multiple functions share dependencies will experience cross-functional cascades. That is physics, not pathology. The question is why these cascades remain invisible, and why they are becoming more dangerous, not less.
The invisibility has a single root cause that operates at two scales.
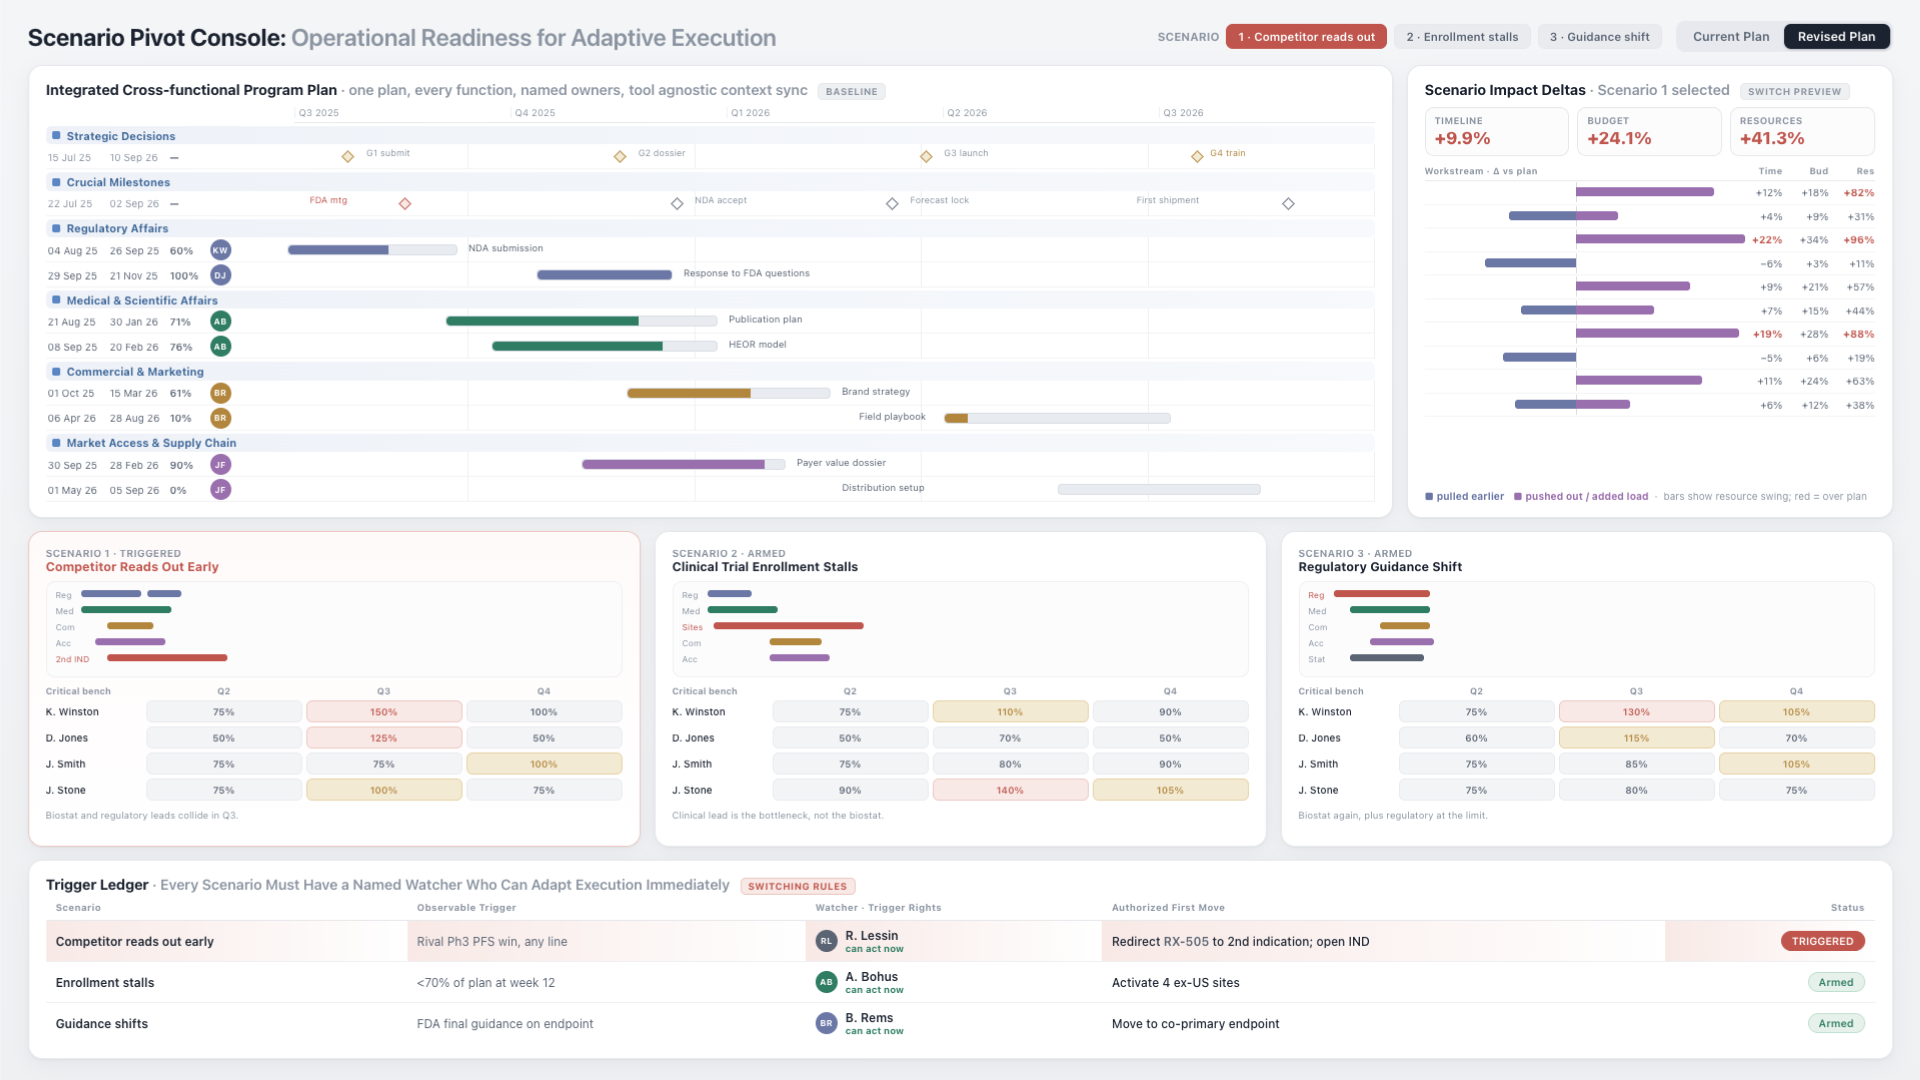
At the portfolio level, project management tools reinforce what might be called the "list view" of the portfolio. Planisware, MS Project, Smartsheet, and their peers manage programs as discrete entities. They allow cross-project dependency lines, technically. But those lines require a human to identify the coupling, draw the connection, and maintain it as conditions change. The tool does not understand that Program A's CDMO campaign uses the same facility as Program C's tech transfer, or that Program D's regulatory submission competes with Program F for the same writing team. Data integration platforms move data between these tools. They do not interpret the relationships the data implies.
At the program level, the same fragmentation repeats at a different altitude. Within a single drug program, functional teams operate in functional tools. Clinical Development works in Planisware. CMC tracks milestones in Smartsheet. Regulatory Affairs manages submissions in MS Project. Supply Chain operates in SAP. Commercial plans in Google Sheets. Medical Affairs in Excel. Digital and IT in ServiceNow and Jira. Pharmacovigilance in Asana. One program. Eight functions. Eight tools. Zero real-time interdependency awareness.
When CMC's timeline shifts in Smartsheet, Regulatory's submission window in MS Project does not know. When Clinical's enrollment slips in Planisware, Supply Chain's manufacturing trigger in SAP does not update. When Supply Chain flags a delay in SAP, Commercial's launch plan in Google Sheets continues operating on assumptions that are no longer true. The team leader can see a red dot on a dashboard assembled from these eight sources. But the people doing the work, the ones who could actually respond to a cascade in progress, have no idea which other functions are affecting their execution right now.
This is where a common misconception deserves direct attention. Most operations organizations believe the coordination problem is solved because they have invested in data infrastructure. Snowflake pools the data. Databricks processes it. Mulesoft connects the APIs. Control towers and dashboards present consolidated views. Leadership can see what happened. But the dashboard is a photograph of the gap, not a bridge across it. It tells you the cascade already occurred. It does not prevent it. The functional teams continue operating in their functional tools, making decisions based on assumptions about other functions' timelines that may have changed hours ago in a system they never see.
The dashboard is a photograph of the gap, not a bridge across it. It tells you the cascade already occurred. It does not prevent it.
If dark matter is the invisible coupling that holds the portfolio together, binding programs through shared resources and binding functions through shared timelines, then there is a force that deserves equal attention: what physicists call dark energy. In cosmology, dark energy is the invisible force accelerating the expansion of the universe, pushing galaxies apart faster than gravity can hold them together. In a pharmaceutical portfolio, dark energy is the set of forces making cascades more frequent, faster-propagating, and harder to detect every year.
Three forces are accelerating simultaneously.
The patent cliff is compressing more programs into the same finite resources. With $200 to $300 billion in revenue at risk through 2030, every major pharmaceutical company is racing to fill its pipeline. More programs entering development means more programs competing for the same CDMO partners, the same regulatory writers, the same QC laboratories, and the same specialist talent. The coupling density increases with every program added to the portfolio.
Restructuring waves are eliminating the only detection mechanism that existed. Between 2024 and 2026, the industry reduced its workforce by an estimated 50,000 to 70,000 positions globally. The coupling knowledge, the understanding that Program A's timeline change would affect Program B, or that a CMC delay in Smartsheet would cascade into Regulatory's MS Project, was never in a system. It was in someone's head. As Drug Discovery News observed: "Strategy resides in people, not systems." When those people leave, the last informal detection mechanism leaves with them.
And the $370 billion manufacturing investment, for all its strategic importance, is intensifying coupling in the one channel the industry can least afford to constrain. Every new facility requires specialists from the same finite talent pool. Ninety-four percent of life sciences CEOs plan to increase headcount over the next three years, competing for the same QA/QC professionals, validation engineers, and regulatory writers who are already in short supply. Capacity investment in one coupling channel accelerates coupling in another.
Dark matter is the invisible structure connecting your programs through shared resources. Dark energy is what makes that structure more dangerous every year: more programs, fewer people who understood the coupling, and capacity investment that solves one channel while intensifying another.
The coupling is not static. It is accelerating. And the governance mechanisms designed to detect it are not getting faster.
What Dark Matter Is Costing
The costs are not hypothetical. They are visible in the data, if you know where to look.
IQVIA's analysis of new drug launches found that fewer than 10 percent achieve what the firm classifies as "launch excellence." Seventy percent of products that miss expectations at launch continue underperforming through their commercial lifecycle. The conventional explanation attributes missed launches to commercial missteps: wrong positioning, wrong pricing, wrong market access strategy. That explanation is sometimes true. But it does not account for how many of those missed trajectories trace not to the launching program's own failures, but to cascades from other programs or other functions that compressed timelines nobody saw shifting. When a CMC delay in one program consumed shared manufacturing capacity, and the launching program's supply timeline compressed by three months as a result, the commercial team that inherited a truncated pre-launch window did not experience a commercial problem. They experienced the downstream consequence of a cascade that originated in a coupling channel nobody was watching.
At the portfolio level, the aggregate picture is stark. BCG's analysis of biopharma total shareholder return over 2021 to 2025 found effectively zero percent return, compared to 16 percent for the S&P 500. The causes are multiple and complex: patent cliffs, pricing pressure, R&D inflation. But when cascades that nobody modeled turn three green programs red simultaneously, the impact on revenue projections, investor confidence, and strategic optionality compounds far beyond what any single program delay suggests. Portfolio-level value destruction is not the sum of individual program delays. It is the product of their interaction through coupling channels that governance never saw.
The CDMO sector offers a concrete illustration. The industry invested $24.86 billion in contract manufacturing capacity in 2025 alone, with 74 percent directed to the United States. Physical capacity is expanding. But 60 percent of CDMOs remain at what PharmaSource describes as "preliminary digital maturity," despite 92 percent of sponsors demanding digital capabilities from their manufacturing partners. More capacity without better cascade visibility means more nodes in the network, not fewer coupling points. Patheon's data is instructive here: integrated CDMO workflows, where sponsor and manufacturer share real-time visibility into each other's timelines and dependencies, reduced project timelines by 16 months compared to fragmented multi-vendor approaches. That is not a process improvement. That is a portfolio-level cascade reduction, achieved by making one coupling channel visible and coordinated.
Sixteen months. That is the operational prize of getting coordination right in a single coupling channel. Multiply that by five channels, across hundreds of programs, and the scale of what dark matter costs becomes difficult to overstate.
From List to Network
The shift required is conceptual before it is technical, and it operates at both scales.
At the portfolio level, organizations need to stop governing their portfolio as a list and start governing it as a network. The distinction matters. A list evaluates each program independently: status, risk, milestone adherence. A network evaluates the relationships between programs: which ones share resources, where contention exists, and what cascades when something shifts.
The practical starting point is mapping resource-mediated coupling across the top twenty programs. Identify every shared resource: CDMO partner, manufacturing site, key specialist personnel, regulatory writing capacity, committee bandwidth. Plot the overlaps. The resulting map will reveal clusters of coupling that no individual project plan contains, programs that appear independent but are bound together through resources that both treat as exclusively their own.
Portfolio-level buffers at coupling points are the next step. Individual programs already pad their timelines. But portfolio-level slack, reserves of shared resources designed to absorb cross-program disruptions, is almost never designed in. Operations research is clear on this point: strategically placed portfolio buffers outperform program-level padding because they address the actual source of variance. The variance is not within programs. It is between them.
Capacity is strategy. CDMO capacity, specialist expertise, tech transfer bandwidth, and regulatory writing capacity should appear at portfolio governance with the same rigor and frequency as clinical data and regulatory strategy. The Novo-Catalent case and the $370 billion response prove this is not an operational detail. The question is whether governance will treat it as strategy across all five coupling channels, or only the one that became impossible to ignore.
At the program level, the shift is from functional tool silos to cross-functional interdependency awareness. The eight tools serving one program each capture functional reality accurately. The problem is not the tools. It is that no layer interprets what a change in one tool means for the others. When CMC's Smartsheet timeline shifts, Regulatory's MS Project submission window should know. When Clinical's Planisware enrollment slips, Supply Chain's SAP manufacturing trigger should update. Not because someone assembled a report three weeks later. Because the relationship between those milestones is understood and monitored continuously.
Post-mortems offer an immediate, no-technology-required starting point. When a program misses a milestone, trace backward: was the root cause a resource consumed by a different program? A delay that propagated from another function's tool that the affected team never saw? Build institutional pattern recognition, one post-mortem at a time. Over time, this creates the knowledge base to predict cascades rather than explain them after the fact.
Detecting What You Cannot See
Could the recognition that transformed manufacturing extend to the other four coupling channels?
The early evidence suggests it is already beginning. Applied Clinical Trials reported in December 2025 that large pharma companies are "moving back to primarily insourced models" for clinical operations. McKinsey observed "a return to more insourcing" in clinical development, with Functional Service Provider models growing at 8.68 percent annually as sponsors seek more control over shared clinical resources. Pfizer received an FDA 483 citation for "inadequate oversight" when it fully outsourced clinical monitoring, and subsequently pulled monitoring back in-house. The same dynamic that made manufacturing capacity a portfolio-level strategic priority, the recognition that dependence on shared external resources creates uncontrollable coupling, is emerging in clinical operations.
The same dynamics exist in every coupling channel. Regulatory writing bandwidth, QC laboratory time, tech transfer expertise, and specialist talent are all shared resources through which programs propagate delays. Organizations that recognized cascades in CDMO capacity will eventually recognize them in these channels too. The question is not whether. It is how expensive the wake-up call needs to be for each one.
Detection is what separates organizations that react to cascades from organizations that anticipate them. And detection requires something that neither project management tools nor data infrastructure currently provide.
Current state: PM tools manage programs as discrete entities. Integration platforms move data between functional systems. Neither interprets what a change in one program means for another, or what a change in one function's tool means for the rest of the program. The coupling sits in someone's head, if you are lucky. If that person left in the last round of restructuring, the coupling sits nowhere.
What is needed is an intelligence layer that operates at both scales. Across programs: when Program A's CDMO campaign shifts, automatically surface which other programs share that capacity and what the downstream implications are. Within programs: when CMC's Smartsheet timeline shifts, automatically surface how that affects Regulatory's MS Project submission window and Commercial's Google Sheets launch plan. Not another dashboard that shows you what already happened. A coordination layer that detects what is about to cascade, that understands the difference between connected systems that move data and coordinated systems that interpret meaning.
The FDA itself recognizes this architecture gap. The Complex Drug Research Program pilot endorses parallel development pathways specifically because CMC has become the rate-limiting step in too many programs. The regulator sees the coupling. The question is whether organizations will see it in their own portfolios, at both altitudes, before the next cascade arrives.
The Invisible Majority
Those biotech companies that lost their manufacturing slots in December 2024 did not lose them because their programs had problems. They lost them because a decision in someone else's portfolio cascaded through a coupling channel that appeared in no project plan, no risk register, and no dashboard. That was the dark matter at the macro scale. And $370 billion says the industry finally saw it.
But within every one of those programs, right now, eight functional teams are working in eight tools. When something shifts in one tool, the others do not know. The team leader sees a dashboard. The teams see their tool. The interdependencies between them are invisible, carried in someone's head or discovered in the next status meeting, weeks after the cascade began. That is the dark matter at the micro scale. And no amount of capital investment addresses it.
The dark energy, the forces accelerating both forms of coupling, is not slowing down. More programs competing for fewer shared resources. Fewer people who understood where the coupling existed. More physical capacity being built without the coordination layer to prevent cascades within it.
In physics, scientists spent decades theorizing about dark matter before developing instruments sensitive enough to detect its gravitational effects. The dependencies in your portfolio do not require decades of theorization. They require the willingness to look at the portfolio as a network rather than a list, and at each program as an interconnected system rather than a collection of functional workstreams that happen to share a molecule.
As we explored in Four Companies Wearing One Logo, the functional fragmentation within pharmaceutical organizations is architectural, not accidental. This article adds a second dimension: the fragmentation is not only within programs. It is between them, propagating through coupling channels that no coordination artifact currently captures, binding programs together through dependencies that no portfolio governance process currently detects.
Patients are waiting for medicines trapped in cascades that nobody modeled. The science is ready. The governance, the tools, and the organizational willingness to see the invisible forces shaping their portfolio could catch up. It is a choice.
The dark matter is not going away. Coupling is inherent in any portfolio that shares resources and any program where functions share dependencies. The question is whether you detect it before it determines your trajectory, or explain it afterward.
References
- DPR Construction Q4 2025 Report, "Pharmas Have Poured $370B Into US Manufacturing Amid 2025's Onshoring Boom." Via Fierce Pharma. $370B committed, 22 new manufacturing sites, ~44,000 new jobs.
- Think Global Health / Council on Foreign Relations, "Tracking Pharma's Progress on U.S. Onshoring." $480B total commitments with healthy skepticism on execution timelines.
- Outsourced Pharma, "2025 GLP-1 Impacts Tell Us About CDMOs in 2026." Novo/Catalent cascade effects, biotech displacement from manufacturing slots.
- CSG Talent, "The Pharma Manufacturing Shift: Implications for CDMOs and Commercial Leadership." Capacity as strategic asset, competitor vulnerability through shared CDMO dependence.
- DCAT Value Chain Insights, "Big Pharma & US Manufacturing Investment." Company-by-company investment breakdown.
- Eli Lilly Investor Relations, "Lilly Plans to More Than Double US Manufacturing Investment." Lebanon groundbreaking 2023, $50B total US commitment.
- PharmaSource, "The Great Reshoring: How $24.86B Reshaped CDMO Manufacturing in 2025." $24.86B in CDMO investment, 74% directed to US, 732 CDMO announcements tracked.
- PharmaSource, "What to Expect in Pharma Manufacturing in 2026." Specialized bottlenecks as norm, manufacturing slots impacting company valuation.
- PharmaSource, "Four Forces Reshaping Pharma Outsourcing in 2026." Talent scarcity in QA/QC and validation as "structural bottleneck," dual-sourcing trends.
- Applied Clinical Trials, "Resourcing and Outsourcing Trends in Drug Development." 25 biopharma leaders interviewed. Large pharma moving to primarily insourced clinical operations models.
- Outsourced Pharma, "2026 CDMO Forecast: 7 Shifts Sponsors Need to Prepare For." FDA warning letters increasing, CDMOs applying more conservative scheduling assumptions.
- World Pharma Today, "Smarter Resource Planning for Complex Pharma Development Portfolios." Minimal slack in resource allocation, annual planning cycle fragility.
- Pharmaceutical Technology, "Supreme Court Rejection of Trump Tariffs Has Nuanced Implications for Pharma Importers." $370B+ already committed regardless of tariff legal outcomes.
- Browning and Yassine, "Resource-Constrained Multi-Project Scheduling." Analysis of 12,320 multi-project test problems: resource contention between projects determines cascade behavior.
- IQVIA, "2025 Report: New Drug Launches." Fewer than 10% of launches achieve "launch excellence." 70% of underperformers never recover trajectory.
Further Reading
- Four Companies Wearing One Logo: The Architecture of Disconnection
- The Coordination Fallacy: Two Realities in Drug Development
- The Kill Decision Problem: Why the Hardest Portfolio Choice Is the One Nobody Wants to Make
- Why Connecting Data Isn't Enough: The Coordination Imperative for Accelerating Medicines

Compliance
Unipr is built on trust, privacy, and enterprise-grade compliance. We never train our models on your data.


Start Building Today
Log in or create a free account to scope, build, map, compare, and enrich your projects with Planner.